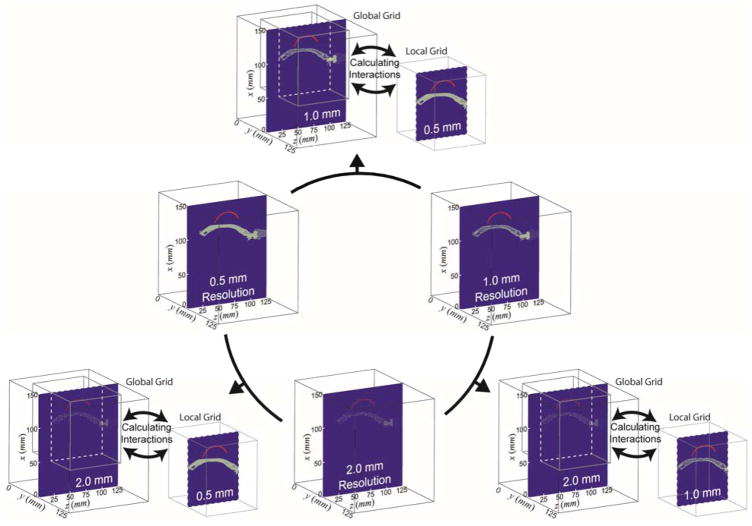
Figure 5.
Schematics of the grid settings for the implemented acoustic simulation. The fixed-resolution simulations were performed with various resolution settings of ‘0.5 mm grid’ (left, middle row), ‘1.0 mm grid’ (right, middle row), and ‘2.0 mm grid’ (middle, bottom row). The multi-resolution simulations were performed using the combination of two resolution settings (‘0.5&1.0 mm grids’, ‘0.5&2.0 mm grids’, and ‘1.0&2.0 mm grids’). The higher resolution setting was assigned to the local grid. On the blue-colored planes, red-colored profiles depict the acoustic source surface profile of the FUS transducer and the gray dots (conveying the information on resolutions) delineate the skull profile.

