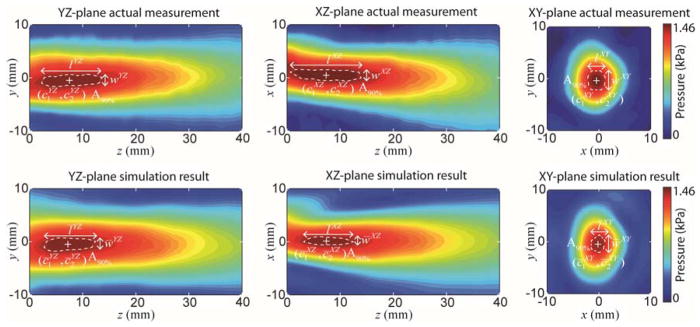
Figure 6.
An example of acoustic pressure distribution on the YZ-, XZ-, XY-plane (from left to right columns) from the actual measurement (top row) and the simulation results (bottom row) obtained from a skull phantom (‘S3’, at y+15° configuration). The resolution setting of ‘0.5 mm grid’ was used. ‘+’ denotes the center of the focus. The white dashed line indicates the region of A90%.

