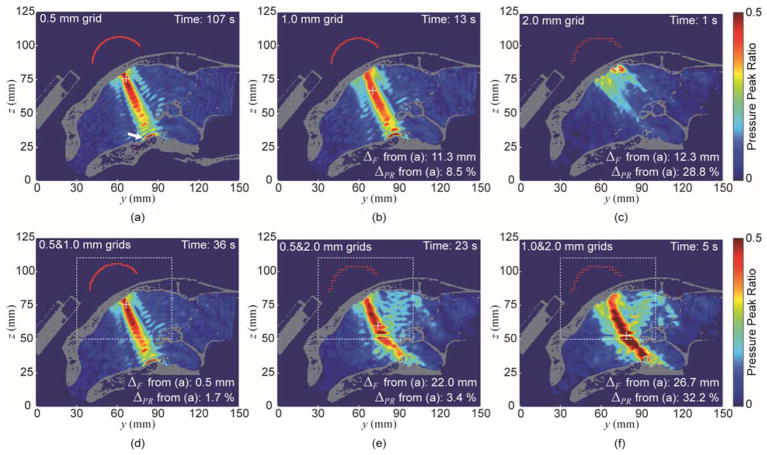
Figure 7.
The simulation results of acoustic pressure distribution on the sagittal plane obtained from (a) ‘0.5 mm grid’, (b) ‘1.0 mm grid’, (c) ‘2.0 mm grid’, (d) ‘0.5&1.0 mm grid’, (e) ‘0.5&2.0 mm grid’, and (f) ‘1.0&2.0 mm grid’. ‘+’ denotes the location of the maximum pressure value. The pressure level inside the skull was pseudo-colored, being scaled with reference to the peak pressure value obtained in the absence of the skull, to represent the pressure peak ratio RYZ. The white dashed line indicates the region of the local grid.

