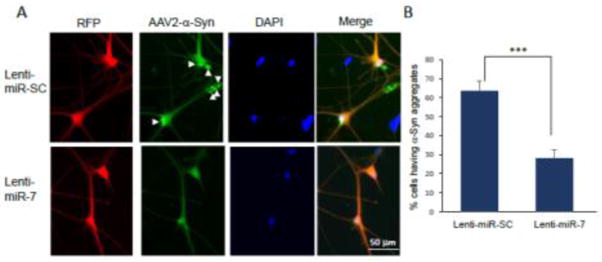
Fig. 2.

Immunocytochemistry showing the decrease of α-Syn aggregates in differentiated ReNcell VM cells with miR-7 overexpression. (A) A representative figure showing miR-7-induced decrease of α-Syn aggregates. Lentivirus-infected cells are detected as red fluorescence and α-Syn expression is detected as green fluorescence. α-Syn aggregates are indicated as white arrowheads. Scale bar = 50 μm. (B) Cells having α-Syn aggregate(s) were counted in 7 randomly-selected fields comprising 10–20 RFP-positive cells (lentivirus-transduced cells). The data represent means ± SEM. *** p < 0.001. These results are representative of three separate experiments.
