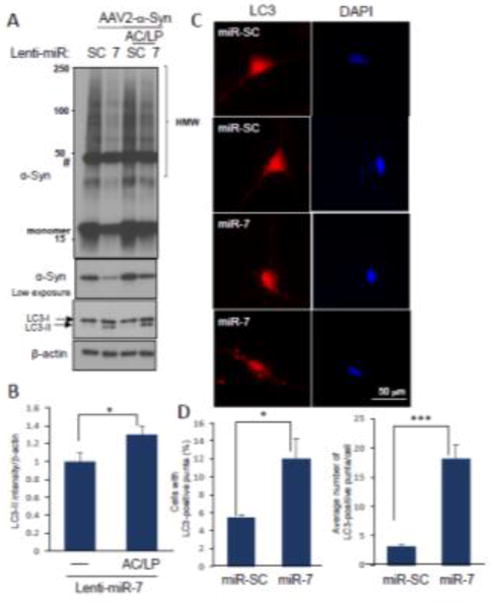
Fig. 3.

miR-7 decreases the levels of α-Syn and its aggregates through promoting autophagy. (A) Differentiated ReNcell VM cells transduced as indicated were further treated with AC (NH4Cl (10 mM)) and LP (leupeptin (100 μM)) for 12 h. Cells were subjected to Western blot analyses to detect α-Syn, LC3B and β-actin. (B) The LC3B-II band is used to measure autophagy flux. Intensity of the LC3B-II band was normalized to that of the β-actin band. The data represent means ± SD. * p < 0.05. (C) Representative figures showing that transfection of pre-miR-7 leads to an increase in the formation of LC3 puncta (red color). Two pictures are provided for each experimental group. (D) Quantitative data showing the percentage of cells having LC3 puncta and the number of LC3 puncta in a cell. The number of cells containing LC3 puncta were counted in 7 different microscopic fields including 10–20 cells for each sample and the percentage of cells having LC3 puncta was calculated. The number of LC3 puncta in a cell was counted with 20 cells containing LC3 puncta. The data represent means ± SEM. * p < 0.05. *** p < 0.001. These results are representative of three separate experiments.
