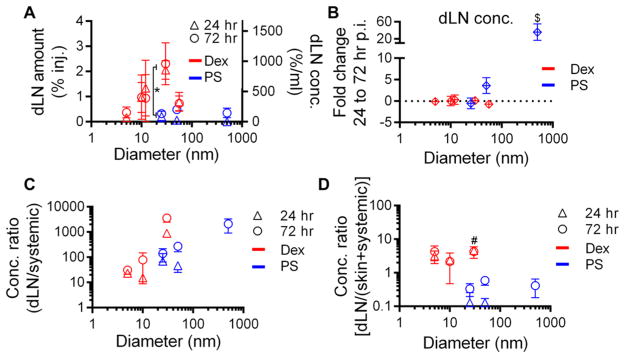
Figure 3.
Tracer accumulation within dLN is greatest for macromolecules, increases most appreciably over time with increasing particle size, and is the most specifically enriched relative to other tissues for macromolecules. (A) Percent of injection amount and resulting concentration of tracer within dLN after dermal injection 24 and 72 h p.i. (B) Fold change in dLN tracer concentrations from 24 to 72 h p.i. (C) Ratio of accumulated tracer concentrations within the dLN versus systemic tissues at 24 and 72 h p.i. (D) Tracer accumulation within dLN versus the skin injection site and systemic tissues at 24 and 72 h p.i. * indicates significant for 25 vs 30 nm tracers by Mann–Whitney U tests, $ indicates significance for 500 vs 50 and 25 nm tracers, and # indicates significance for 30 vs 25, 50, and 500 nm tracers at 24 and 72 h by one-way ANOVA and posthoc Fisher’s LSD tests. The level of 500 nm tracer accumulation within dLN at 24 h p.i. was not detectable.

