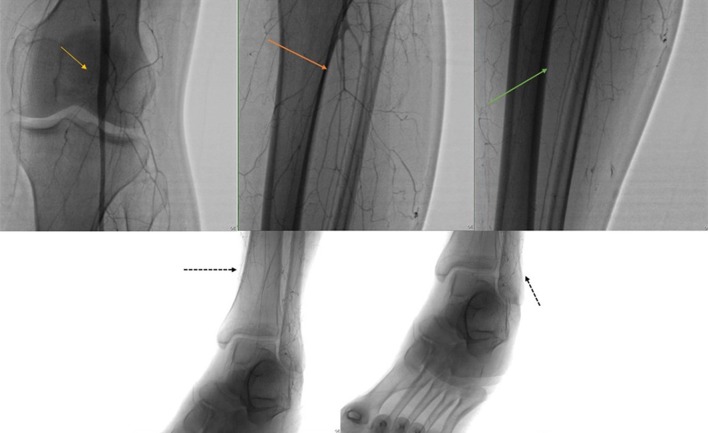
Figure 2.
Multiple images of pretreatment arteriography during the injection phase: yellow arrow represents good flow until the popliteal artery; orange arrow shows diminished to absent flow below the popliteal artery; green arrow shows no flow in tibial and peroneal arteries; dotted black arrows show absence of pedal flow as well as posterior tibialis flow.

