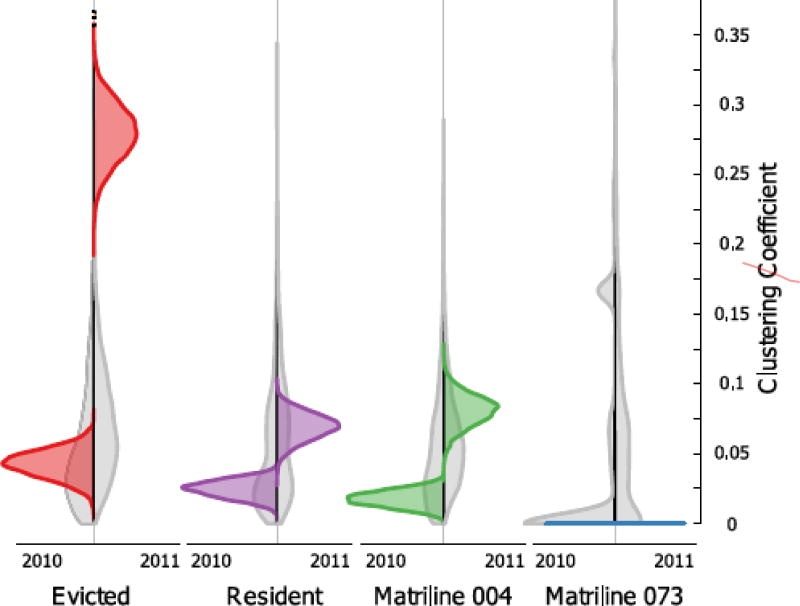
Figure 3.
Mean clustering coefficients by partition. Violin plots showing estimates of the mean clustering coefficient for each partition in each study period. Grey plots show estimates for the given partition and year based on Erdős–Rényi random graphs. Coloured densities represent mean clustering coefficients from 5000 permuted graphs in which we shuffled weights across edges while holding the positions of edges constant.

