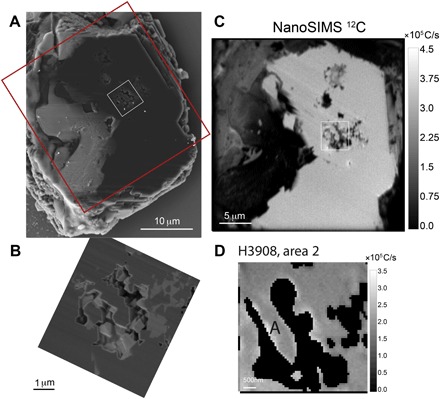
Fig. 2. Sample H3908; upper left corner.

(A) SEM image of a 5- to 8-μm-thick diamond seed plate containing inclusions resulting from FIB preparation. The plate was extracted with a micromanipulator and deposited on a silicon wafer previously placed in the sample chamber of the FIB. Red box, 30 μm × 30 μm; white box corresponding to inclusions, 25 μm2 area. (B) Close-up of a SE-SEM image of the area showing multiphased inclusions. Gray-level contrasts are density-dependent: dark gray, diamond (including diamond inclusions at the center of the image); medium gray, carbonates; and light gray, SiO2 (that is, coesite at 7 GPa). (C) Large NanoSIMS 12C map of the plate. (D) 12C mapping of the 25 μm2 area including the inclusions. “A” corresponds to diamond inclusions.
