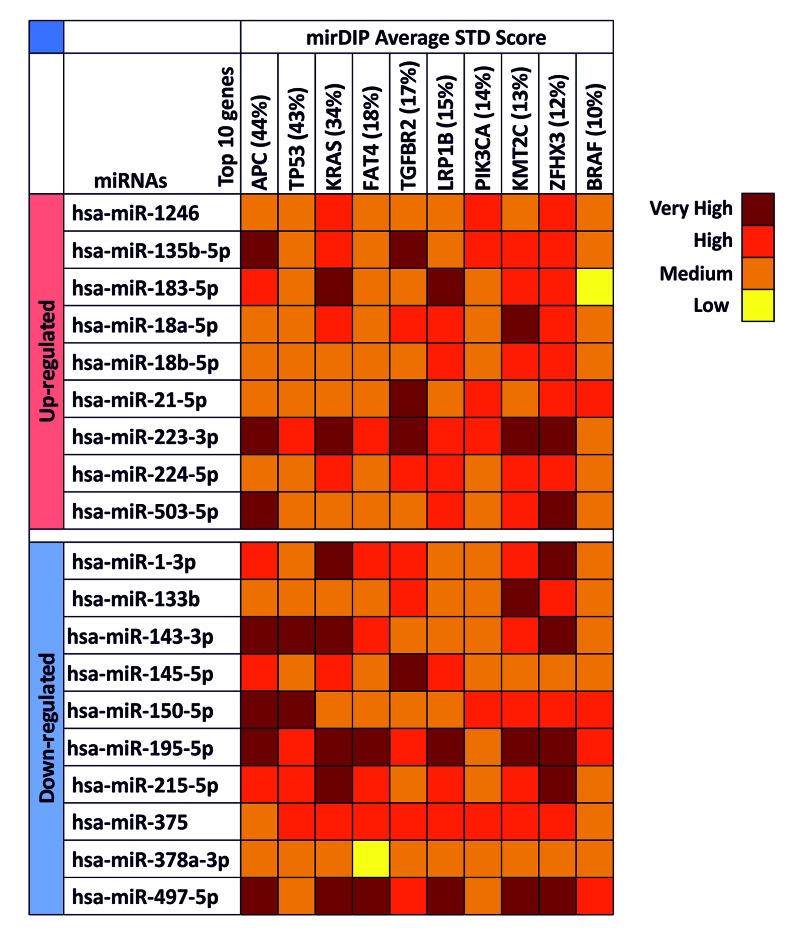
Figure 2.
mirDIP gene target analysis – Interaction between selected miRNAs and main altered genes in CRC. For each miRNA is reported the level of interaction with the 10 genes involved in CRC is reported. The intensity of interaction is highlighted with a color scale ranging from dark red (very high interaction) to yellow (low interaction).

