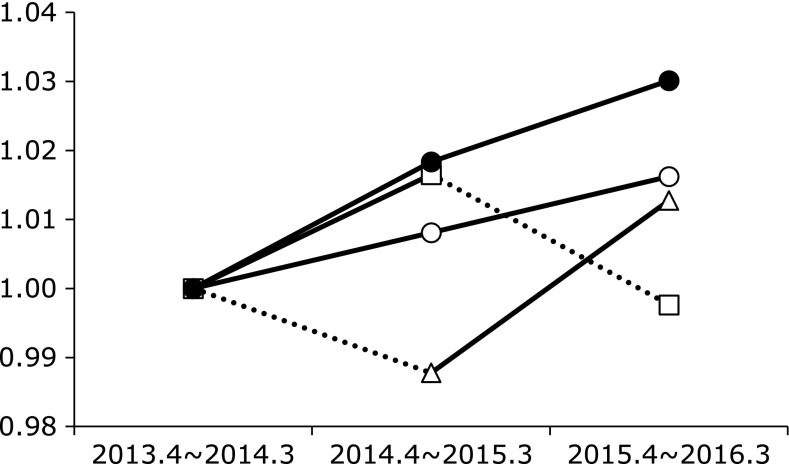
Fig. 3.
Time-course changes of LDL-cholesterol (LDLC)/HDL-cholesterol (HDLC) ratios of 4 groups. Data was express as the ratio to the data of first visit (April 2013 to March 2014). ◯: H. pylori-negative subjects, ●: H. pylori-positive subjects, △: H. pylori-eradicated subjects (successful eradication before 2nd visit), □: H. pylori-eradicated subjects (successful eradication before 3rd visit). There was no significant difference in time-course changes of all groups.

