
Figure 2.
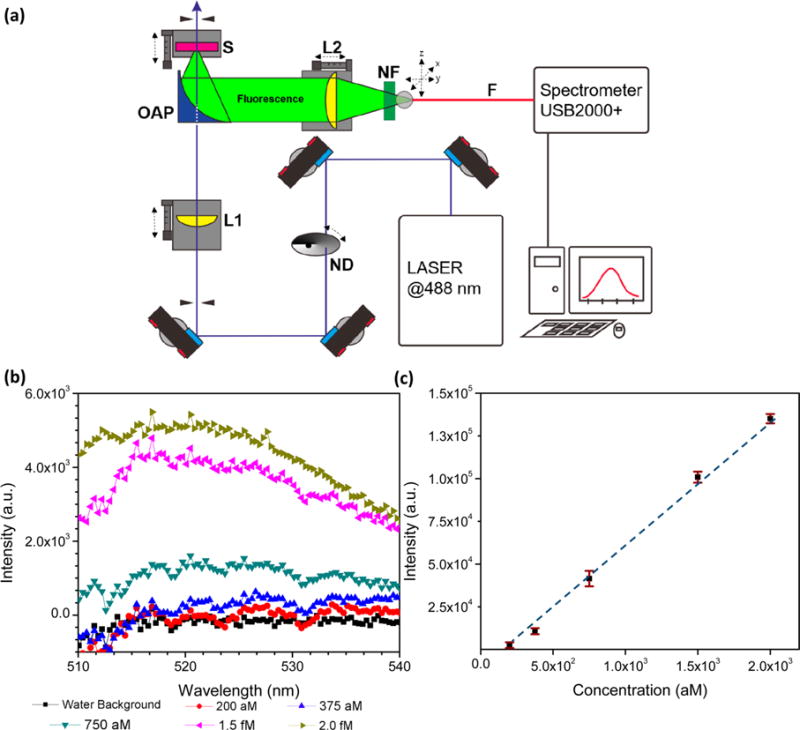
(a) Schematic of the optical-fiber-based fluorometer. Fluorescence signal is collected by the parabolic mirror and detected by a USB 2000 spectrometer. Apparatus: ND, Neutral-density filter; L1 and L2, lenses; OAP, off-axis parabolic mirror; S, sample; F, optical fiber; and NF, notch filter. (b) Uncorrected emission curve of barcode reporter vs various concentrations. The peak is centered at ∼520 nm. (c) Fluorescence intensity vs barcode reporter concentrations shows linear dependence at the attomolar level. The limit of detection of using pure fluorescence probe for the system is ∼200 aM. Error bars indicate standard error of the mean.