
Figure 2.
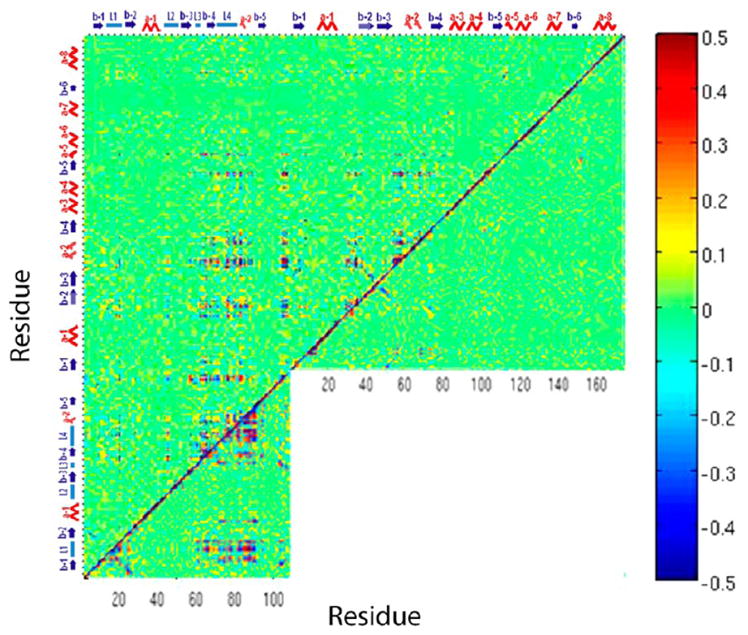
Dihedral angle covariance matrix for plexinB1 RBD bound with Rac1 in HSD state (above diagonal) compared to unbound plexin-B1 RBD (below diagonal, left) and the Rac1 GTPase in the free state (below diagonal, right). The color bar at the side indicates the level of maximal cross-correlation.