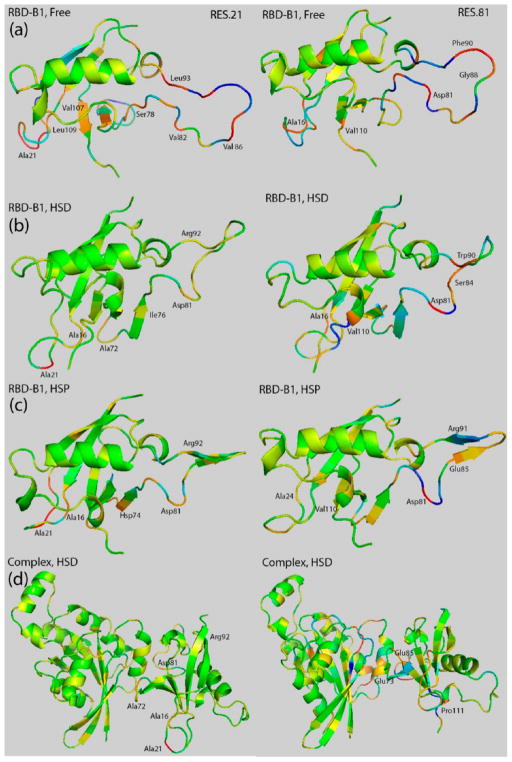
Figure 3.
Covariance coefficient between residue 21 (left)/residue 81 (right) and other residues mapped on the structure of RBD-B1 in the free state (row (a)), in the Rac1 bound HSD state (row (b)), and in the Rac1 bound HSP state (row (c)). The complex with Rac1-GTPase is also shown in the HSD state in order to illustrate the cross-interface correlations (row (d)); the structure is slightly rotated to show the interface and the RBD residues clearly. Residues with the magnitude of their covariance coefficients higher than 0.1 are labeled and colored using the same scale as in Figure 2.

