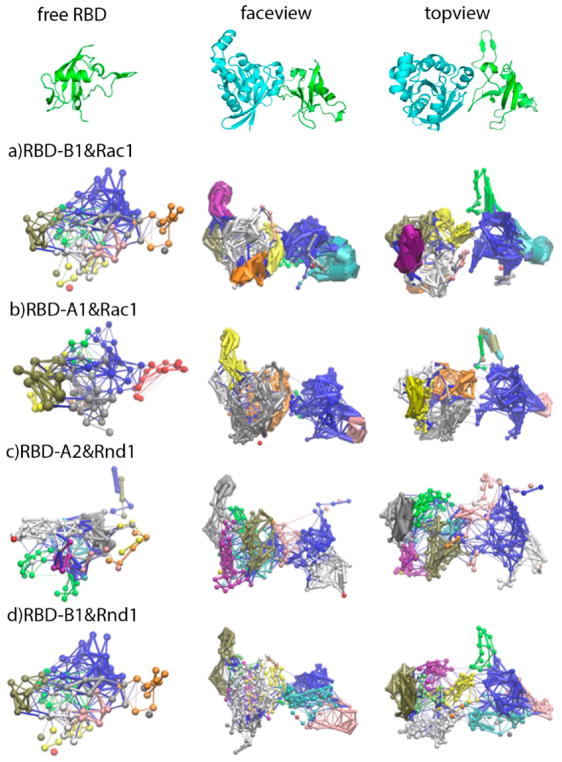
Figure 6.
Community networks formed in the plexinB1 RBD (row (a)), plexinA1 RBD (row (b)), plexinA2 RBD (row (c)), and plexinB1 RBD (row (d)) in free form (left column), and in bound form to Rac1/Rnd1 (HSD) in face-view (middle column), and in topview (right column) based on MD simulation and dynamical network analysis. The free form and bound form network structures are oriented in the same direction as shown in the top of the figure using RBD-B1 (in green) bound with Rac1(in cyan) in the HSD form as example.

