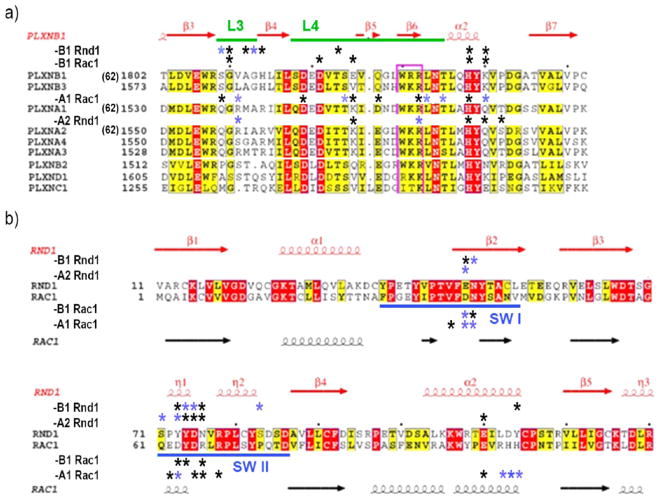
Figure 7.
Sequence alignment of RBD and GTPase interface regions with the 9 members of the human plexin family in (a) and human Rac1 and Rnd1 in (b). * indicates contact with >20% occupancy in the neutral pH simulations (uncharged His), whereas * (blue) indicates additional contacts at low pH (charged His) from SI Tables S4–S11. Figure adapted from ref 18 “Structural Basis of Rho GTPase Rnd1 Binding to Plexin RBDs” by Wang et al, used under CC BY from original.

