Figure 5.

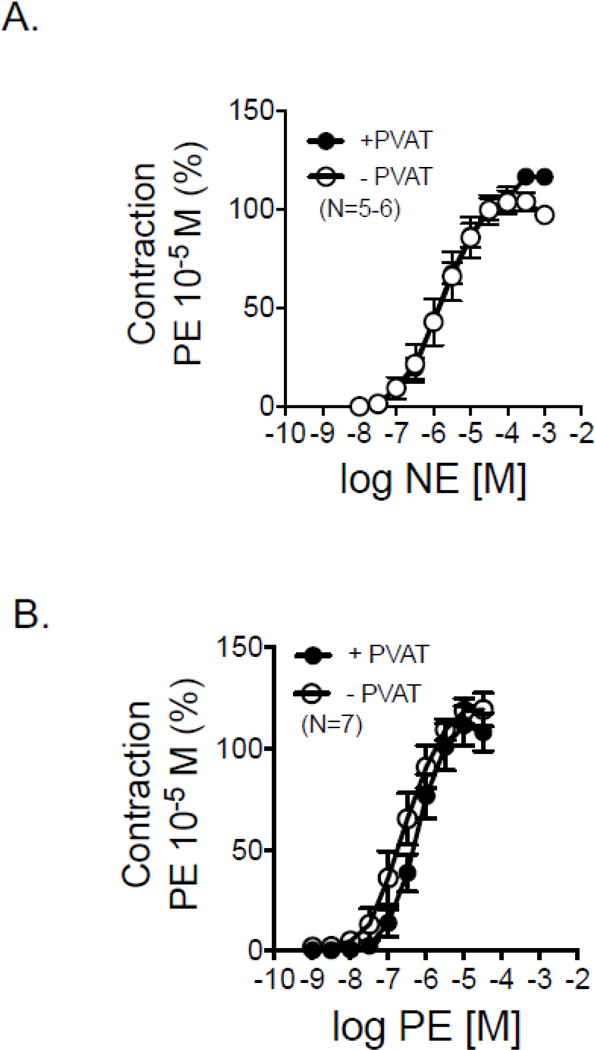
Cumulative concentration response curves to NE (A) and PE (B) in isolated rat renal rings with (+) and without (−) PVAT. Points are means±SEM for number of animals in parentheses.

Cumulative concentration response curves to NE (A) and PE (B) in isolated rat renal rings with (+) and without (−) PVAT. Points are means±SEM for number of animals in parentheses.