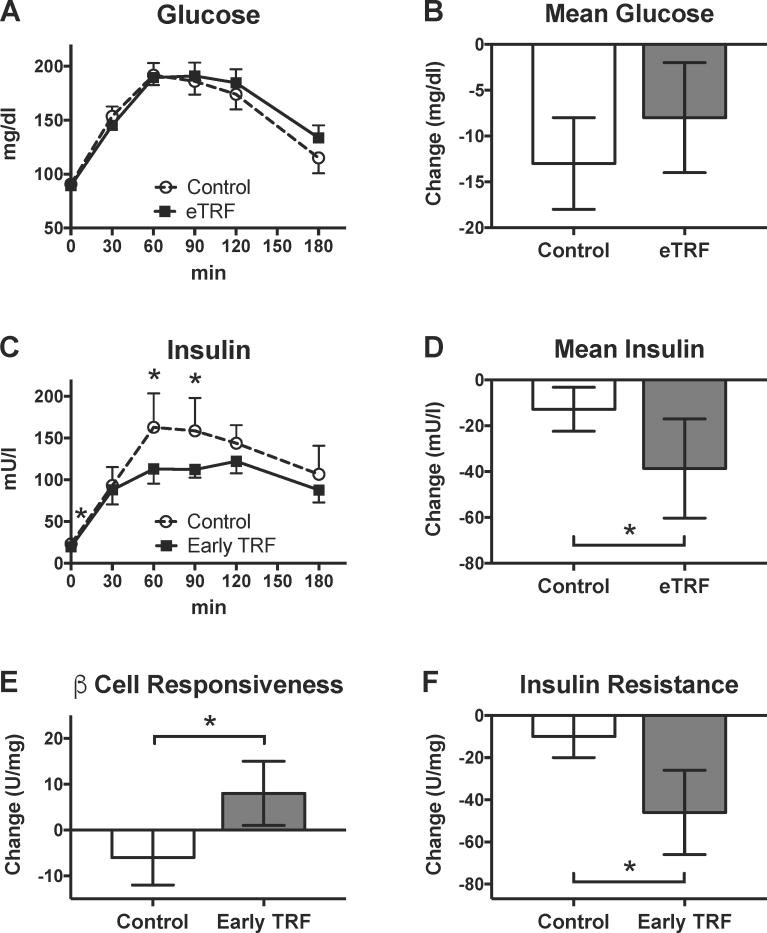
Figure 2. Glycemic Control.
eTRF did not affect (A) individual or (B) mean values for glucose during a 3-hour OGTT. However, eTRF did lower (C) insulin levels at multiple time points and (D) mean insulin levels. Overall, eTRF improved (E) β cell responsiveness and (F) insulin resistance, as measured by the insulinogenic index and the incremental AUC ratio, respectively. (Post-intervention values shown above for (A) glucose and (C) insulin were adjusted for differences at baseline.) All data are paired, with N=8 completers in each arm. Data are presented as least squares mean ± SEM, with the exceptions of panels A and C, which display the data as raw mean ± SEM. * p ≤ 0.05. See also Figure S2 and Table S2.

