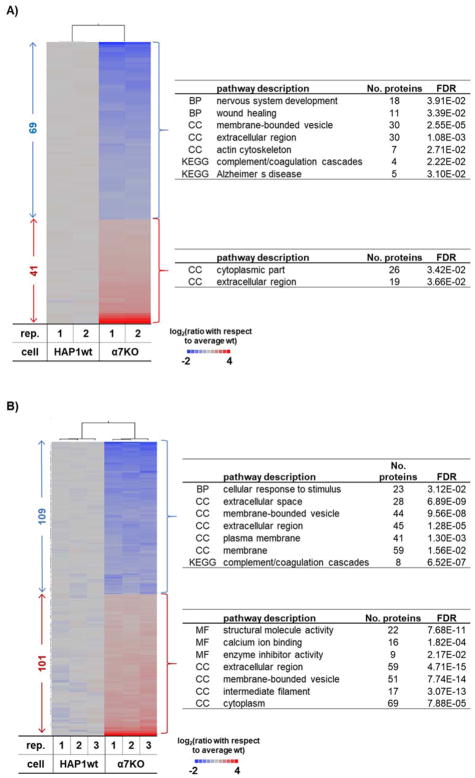
Figure 3. Cell-specific proteome differences between HAP1wt and α7KO HAP1 cell line.
Heat map of proteins with statistically significant differences between HAP1wt and α7KO cell lines in A) untreated and B) nicotine-treated cells. Heat maps include only proteins having a fold-change > |1.5| and a p-value of <0.05 as determined using a Student t-test. To the right of the heat map are the major gene ontology or KEGG pathway categories for which associated proteins are significantly (p-value<0.05) enriched.

