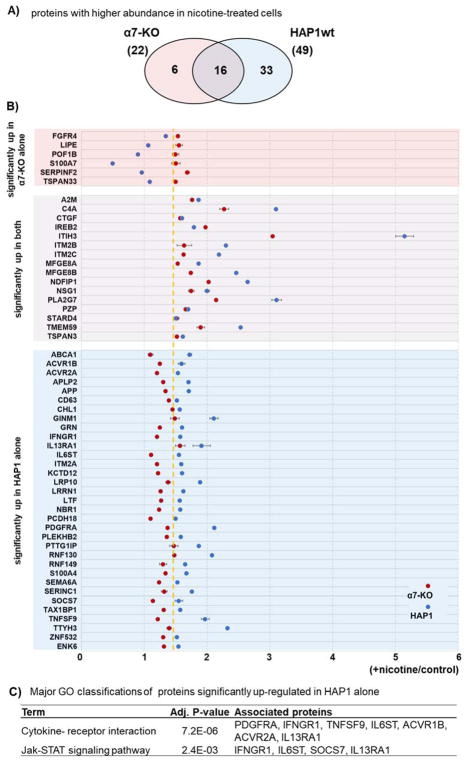
Figure 4. Nicotine-induced protein alterations within and between cell lines.
A) Venn diagram of proteins with statistically significant nicotine-induced up-regulation in α7KO and HAP1wt cell lines. B) Modified dot plot of proteins (n=6) that are of higher abundance in α7KO but not in HAP1wt cell lines (top), proteins (n=16) of higher abundance in both cell lines (middle), and proteins (n=33) of higher abundance in HAP1wt, but not in α7KO cell lines (bottom). Data points represent the average relative abundance measurement for nicotine-treated cells divided by that for untreated cells. Error bars represent standard deviations. Dashed yellow line represents the nicotine-to-control ratio of 1.5. C) The KEGG pathway categories that are enriched by the associated proteins listed on the right.

