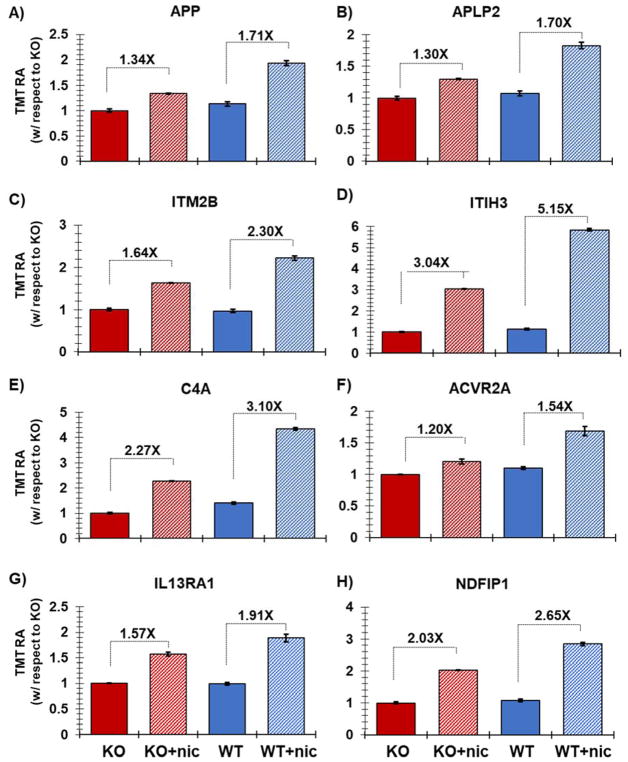
Figure 5. Representative proteins displaying altered expression due to nicotine treatment.
Plotted are the relative TMT signal-to-noise levels for the selected proteins across the two controls and three nicotine-treated samples for each cell line. The proteins highlighted include: A) Amyloid beta A4 protein (APP), B) Amyloid-like protein 2 (APLP2), C) ITM2B (integral membrane protein 2B), D) ITIH3 (inter-alpha-trypsin inhibitor heavy chain H3), E) complement C4-A (C4A), F) ACVR2A (Activin receptor type-2A), G) IL13RA1(interleukin 13 receptor, alpha 1), and H) NDFIP1 (NEDD4 Family Interacting Protein 1). Error bars represent standard deviations.

