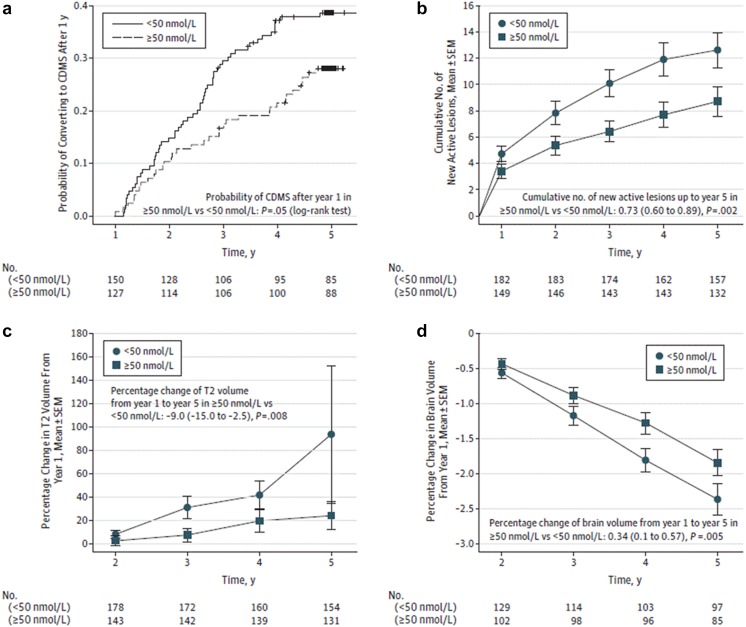
Fig. 6.
Multiple sclerosis outcomes according to dichotomous serum 25(OH)D levels. Analyses are based on patients with averaged 6- and 12-month measurements of 25(OH)D. Group comparisons are adjusted for age, sex, treatment, time of follow-up, and T2 lesion score at baseline. The graphs show the probability of conversion to CDMS after 12 months (a); the cumulative number of new active lesions on brain MRI (b); the percentage change in T2 lesion volume from year 1 to year 5 on brain MRI (c); and the percentage change in brain volume from year 1 to year 5 (d). The error bars indicate the standard error of the mean (SEM).
Reproduced with permission from [60]. Copyright©2014 American Medical Association. All rights reserved

