Fig. 3.
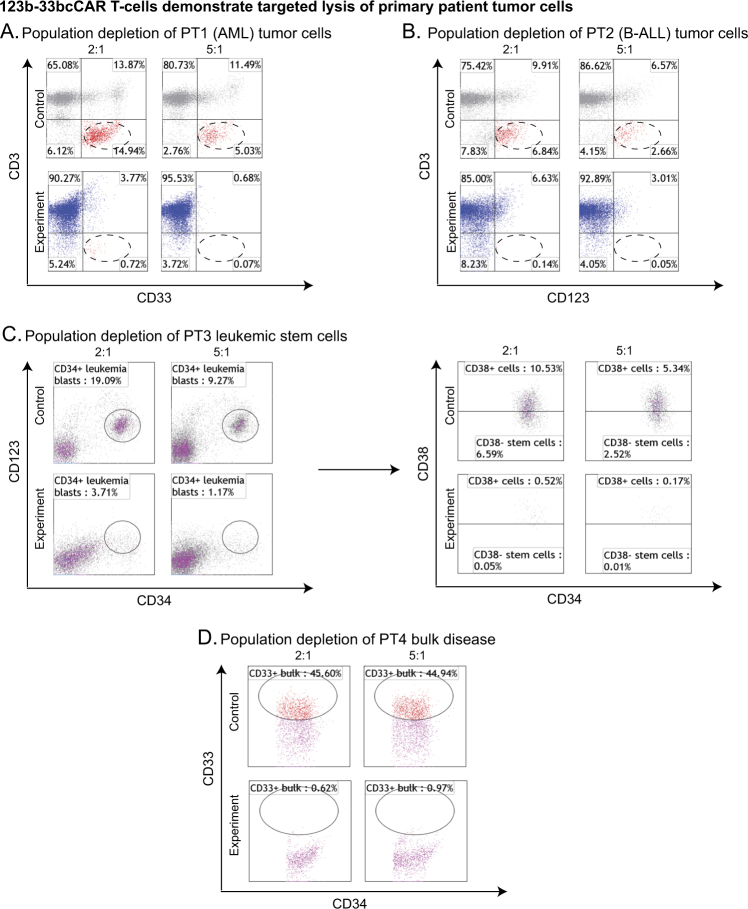
123b-33bcCAR T-cells demonstrate targeted lysis of primary patient tumor cells. All target populations encircled. a Flow cytometry analysis of control T-cells and 123b-33bcCAR T-cells against PT1 tumor target cells at 2:1 and 5:1 E:T ratios. b Flow cytometry analysis of control T-cells and 123b-33bcCAR T-cells against PT2 tumor target cells at 2:1 and 5:1 E:T ratios. c Flow cytometry analysis of control T-cells and 123b-33bcCAR T-cells against PT3 tumor target cells at 2:1 and 5:1 E:T ratios. The target cell population (CD123+CD34+) is further broken down by CD38 expression to display LSC (CD123+CD34+CD38-) elimination. d Flow cytometry analysis of control T-cells and 123b-33bcCAR T-cells against PT4 tumor target cells (CD33+ bulk disease) at 2:1 and 5:1 E:T ratios

