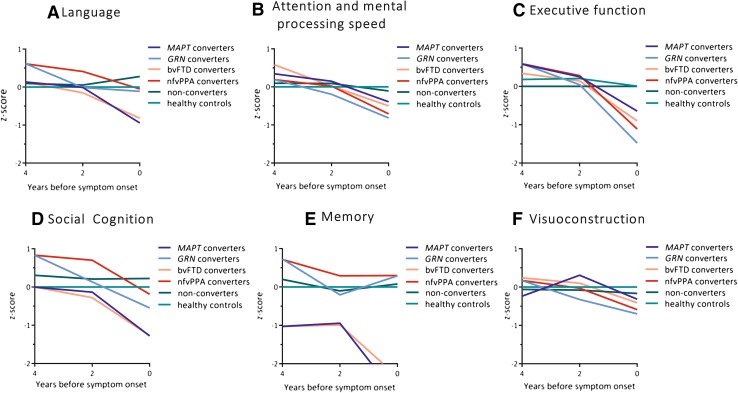
Fig. 2.
Multilevel linear regression model displaying longitudinal decline (4 years, 2 years and after symptom onset) in composite domain z-score in the total group of converters (light green), MAPT converters (light blue dotted line), GRN converters (dark blue dotted line), non-converters (dark green) and healthy controls (black). Models are displayed per cognitive domain: a social cognition, b attention and mental processing speed, c executive functioning, d memory, e visuoconstruction, and f language. NB: the healthy controls have a mean z-score of zero by default as the z-scores of mutation carriers were based on that (raw score minus mean score of healthy controls, divided by the standard deviation of healthy controls). MAPT microtubule-associated protein tau, GRN progranulin

