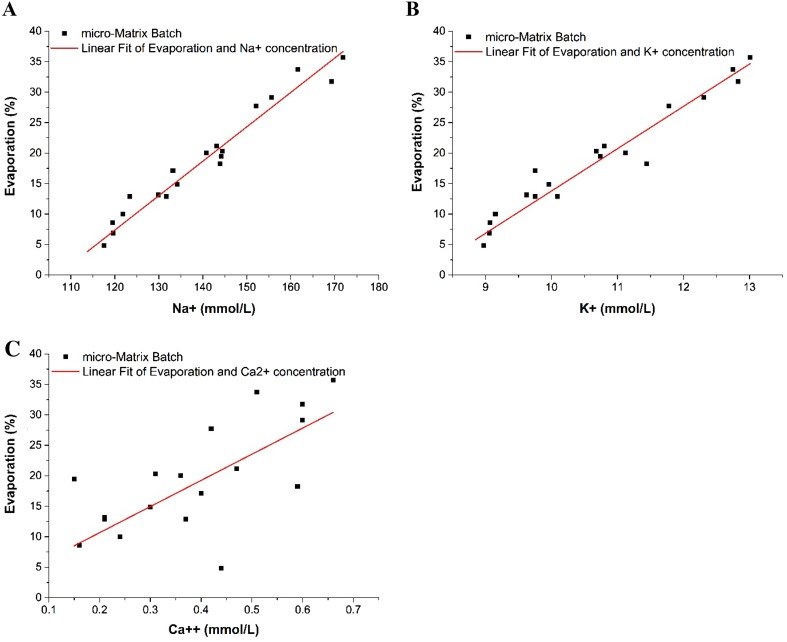
Fig. 2.
Concentration of the electrolytes Na+ (a), K+ (b), and Ca2+ (c) depending on the relative evaporation (filled square), respective linear correlations (line) during a batch culture with GS-CHO cells grown in the micro-Matrix. The shaking speed was set to 220 rpm at a working volume of 3.5 mL. The DO was controlled at 30% and the pH at 7.2. Na+: y = 0.56·x − 60.4, R2 = 0.95; K+: y = 6.94·x − 55.6, R2 = 0.92; Ca2+: 42.9·x + 2.1, R2 = 0.45. Error bars represent one standard deviation about the mean (n = 3)

