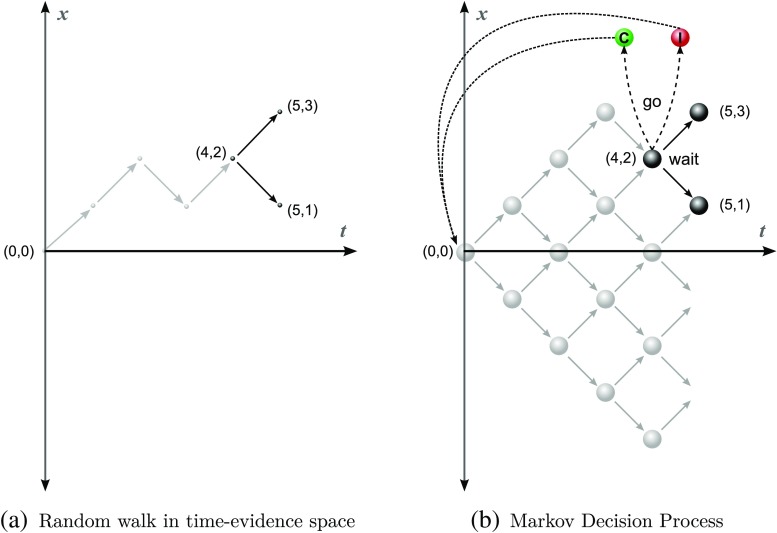
Fig. 1.
a Evidence accumulation as a random walk. Gray lines show current trajectory and black lines show possible trajectories if the decision-maker chooses to wait. b Evidence accumulation and decision-making as a Markov decision process: transitions associated with the action go are shown in dashed lines, while transitions associated with wait are shown in solid lines. The rewarded and unrewarded states are shown as C and I, respectively (for Correct and Incorrect)

