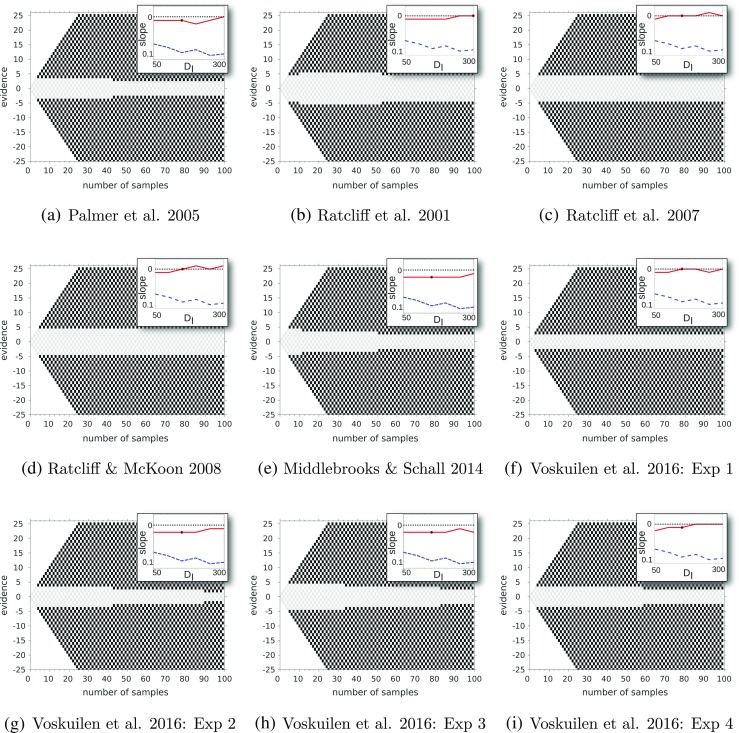
Fig. 11.

Optimal policies for mixture of difficulties used in experiments considered by Hawkins et al. (2015) and Voskuilen et al. (2016). Insets show the slope of the optimal boundary (measured as tangent of a line fitting the boundary) across a range of inter-trial intervals for the mixture of drifts that maps to the experiment (solid, red line) and compares it to flat boundaries (dotted, black line) and the mixture 𝜖 ∈{0.20,0.50}, which gives a large slope across the range of inter-trial intervals (dashed, blue line). The dot in the inset along each solid (red) line indicates the value of inter-trial interval used to generate the optimal policy shown in the main figure
