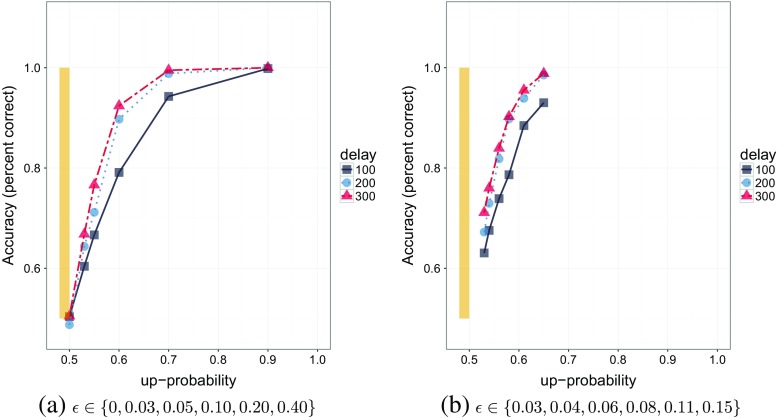
Fig. 12.
A comparison of accuracies between decisions simulated from optimal bounds and decision performed by participants. The two panels show the accuracy of 10,000 simulated decisions during two mixed difficulty tasks, each of which use a mixture of six difficulty levels but differ in the range of difficulties. Panel (a) uses a large range of drifts [0,0.40], while panel (b) uses a comparatively smaller range [0.03,0.15]. Squares, circles, and triangles show these accuracies for an inter-trial delay, D I, of 100, 200, and 300 time units, respectively. The yellow bar on the left of each panel shows the range of accuracies observed in Experiment 1 of Palmer et al. (2005) which used six different motion coherence levels: {0%, 3.2%, 6.4%, 12.8%, 25.6%, 51.2%}

