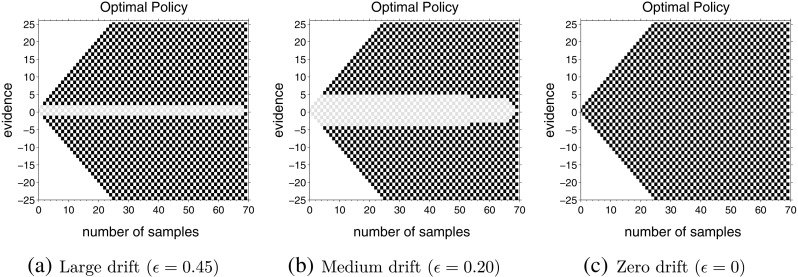
Fig. 2.

Each panel shows the optimal actions for different points in the state space after convergence of the policy iteration. Gray squares indicate that wait is the optimal action in that state while black squares indicate that go is optimal. The inter-trial delays for all three computations were D C = D I = 150 and all trials in a task had the same difficulty. The up-probability for each decision in the task was drawn, with equal probability from (a) u ∈{0.05,0.95}, (b) u ∈{0.30,0.70} and (c) u = 0.50
