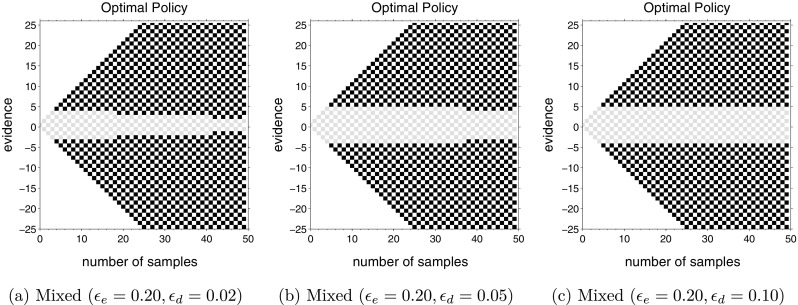
Fig. 4.

Optimal actions for mixed difficulty tasks with different difficulty levels. Each panel shows mixed difficulty task with up-probability for each decision drawn from (a) u ∈{0.30,0.48,0.52,0.70}, (b) u ∈{0.30,0.45,0.55,0.70}, and (c) u ∈{0.30,0.40,0.60,0.70} with equal probability. All other parameters remain the same as in computations shown in Fig. 3 above
