Figure 2.
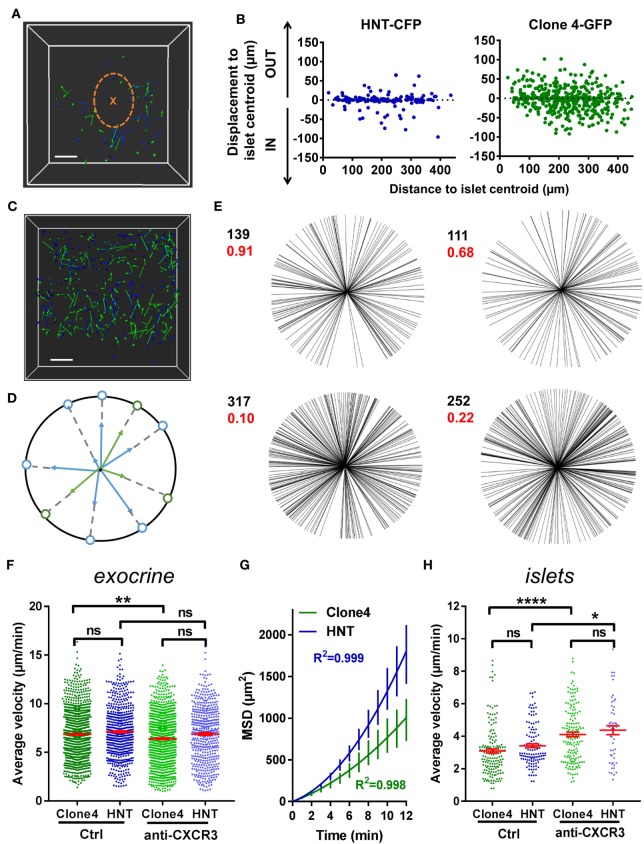
T cells collective migration is not biased toward islets and is mostly independent of CXCR3 signaling. Irradiated InsHA-mCherry mice adoptively transferred with Clone 4-GFP CD8+ and HNT-CFP CD4+ T cells were subjected to intra-vital microscopy on day 8. (A) XY projections of track displacement vectors of T cells in movie in Figure 1A (see Video S1 in Supplementary Material). Scale: 100 µm. Blue and green tracks correspond to HNT-CFP and Clone 4-GFP T cells, respectively. Islet is circled, and a cross marks islet centroid. (B) Clone 4-GFP and HNT-CFP displacement during movies toward (IN) or away (OUT) from islets, as a function of distance from islet centroid at the start of movies (n = 4 mice; 1–2 movies/mouse). (C) XY projections of T cell track displacement vectors in exocrine tissue (see Video S2 in Supplementary Material) (scale: 100- and 200-µm Z-projection; green: GFP, blue: CFP). Movie duration: 10 min. (D) To analyze orientations of T cell directions, displacement vectors were projected on the XY plane and set to a common origin. The orientation of each vector was projected on a circle. (E) Statistical analysis of T cell track orientations in four different movies (without islet) (numbers in black correspond to the number of tracks). None of the analyzed distributions were significantly different from a uniform distribution (Hodjes–Ajne test for circular uniformity, P-values in red). (F) The average velocities of CD4+ and CD8+ T cells in the exocrine tissue (n = 4–6 mice/condition; 2–3 movies/mouse, one-way ANOVA). Dots correspond to individual T cells. CXCR3: anti-CXCR3 mAb-treated mice. (G) MSD of T cells as a function of time in the exocrine tissue, best fitted with a Lévy walk super-diffusive model of migration. Bars correspond to SEM (n = 4 mice per condition; 1–2 movies/mouse). (H) The average velocities of CD4+ and CD8+ T cells in islets (n = 5–6 mice/condition; 1 movie/mouse, one-way ANOVA). Dots correspond to individual T cells. Bars correspond to SEM.

