Figure 5.
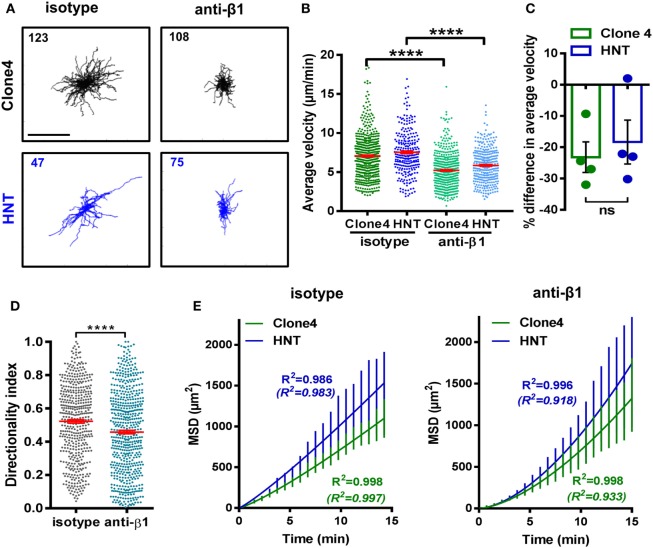
β1 integrin-dependent interactions between T cells and the ECM shape T cell motility. Irradiated InsHA-mCherry mice transferred with Clone 4-GFP and HNT-CFP CD4+ T cells were subjected to intra-vital microscopy on day 8. (A) XY projections of T cell tracks over 15.2 min, 35 min after control IgG or anti-β1 integrin injection (scale: 100 µm) (see also Video S5 in Supplementary Material). Values indicate the number of tracks in movies. (B) The average velocity of T cells in the exocrine tissue of isotype and anti-β1 integrin-treated animals (n = 3 mice/condition; 1–2 movies/mouse; one-way ANOVA). Dots correspond to individual cells. (C) Percentage difference in the average velocity between T cells in the exocrine tissue of isotype and anti-β1 integrin-treated animals. Dots correspond to individual movies (n = 3 mice/condition; 1–2 movies/mouse; P = 0.48, Mann–Whitney). (D) Directionality index of T cells in exocrine tissue (n = 3 mice/condition; 1–2 movies/mouse, Mann–Whitney). (E) MSD of T cells as a function time in the exocrine tissue of isotype and anti-β1 integrin-treated animals were both best fitted with a model of Lévy-type super-diffusive migration (solid lines). Between brackets are R2-values of fit for Brownian random motility. Bars correspond to SEM (n = 3 mice/CD8+ condition; 1–2 movies/mouse).

