
Figure 2.
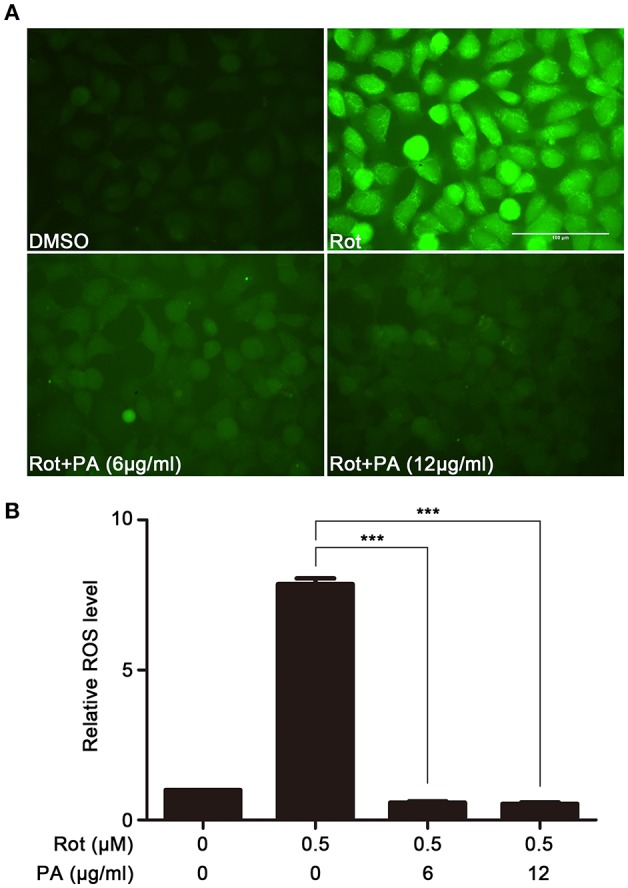
Effects of PA on rotenone-induced ROS generation. (A) Representative images showing the preventive effect of PA against rotenone-induced ROS production. Scale bar: 100 μm. (B) The fluorescence readings were determined with microplate reader. Data are from experiments performed in triplicate and repeated 3 times. ***P < 0.001, compared to control.