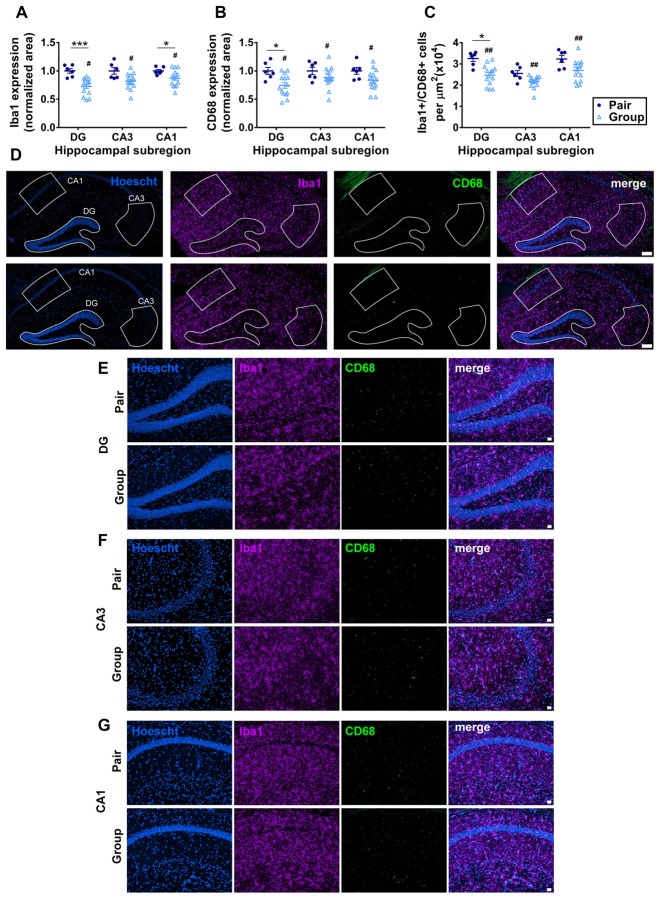
Figure 7.
(A) Percent thresholded area of Iba1 immunoreactivity was significantly less in the hippocampus of group-housed over pair-housed mice, particularly in the dentate gyrus (DG). Two-way RM-ANOVA: main effect of area (p = 0.021), main effect of housing (#p = 0.004), area by housing interaction (p = 0.021), effect of subjects (p < 0.0001). ***p = 0.0009, *p = 0.041, post hoc Welch’s test with Bonferoni correction. (B) Percent thresholded area of CD68 immunoreactivity was significantly less in the hippocampus of group-housed over pair-housed mice, particularly in the DG. Two-way RM-ANOVA: main effect of area (p = 0.352), main effect of housing (#p = 0.015), area by housing interaction (p = 0.352), effect of subjects (p = 0.004). *p = 0.023 post hoc Welch’s test with Bonferoni correction. In both (A,B), each point represents one mouse, normalized to the pair-housed average by brain area. Average ± SEM is also shown. (C) Number of Iba1/CD68 immunoreactive cells per μm2 was significantly less in the hippocampus of group-housed over pair-housed mice, particularly in the DG. Two-way RM-ANOVA: main effect of area (p < 0.0001), main effect of housing (##p = 0.003), area by housing interaction (p = 0.108). *p = 0.027 post hoc Welch’s test with Bonferoni correction. (D) Representative images of Iba1 (purple) and CD68 (green) immunoreactivity in hippocampus of pair- and group-housed mice, including representative outlines of different hippocampal subregions for quantification. Hoescht (blue) provides cell nuclei labeling. Scale bar is 100 μm. (E–G) Higher magnification representative images of Iba1 (purple) and CD68 (green) immunoreactivity in DG (E), CA3 (F) and CA1 (G) of pair- and group-housed mice. Hoescht (blue) provides cell nuclei labeling. Scale bar is 20 μm.

