
FIGURE 3.
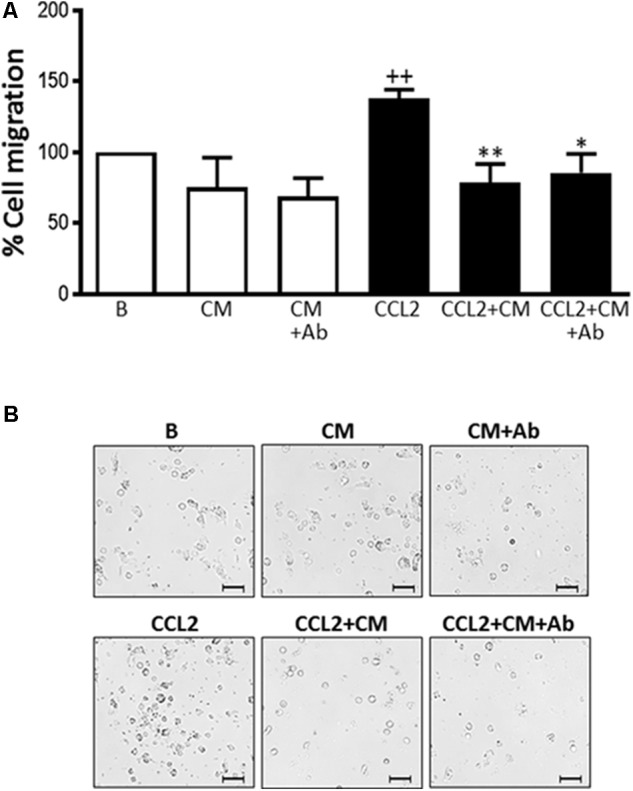
Monocyte migration induced by CCL2. Cell migration was measured after 72 h. (A) Quantitative analysis (mean ± SD from 4 separate experiments with cells from different donors), ++P < 0.01 compared to control (B: nonstimulated cells); ∗P < 0.05, ∗∗P < 0.01 compared to CCL2. (B) Representative images. Microscopic magnification of the objective lens 20 × . Bar = 100 μm.