
FIGURE 4.
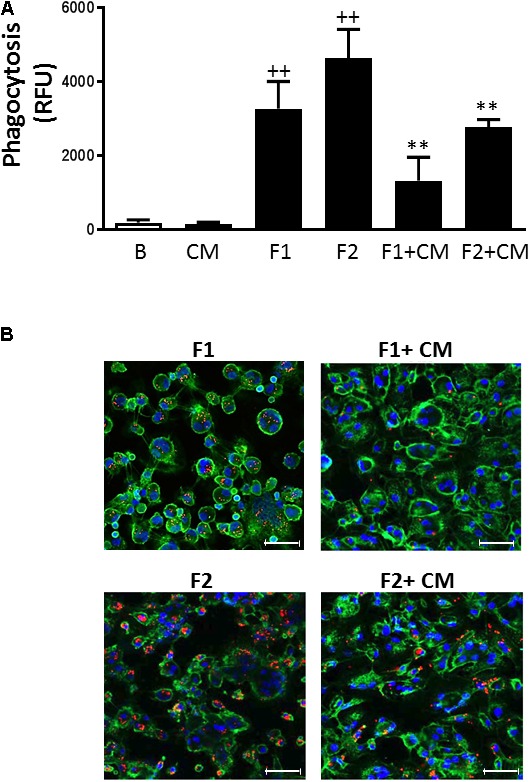
Phagocytosis in human macrophages. Phagocytosis of fluorescent beads was determined after 3 h. (A) Quantitative analysis (mean ± SD from 4 separate experiments with cells from different donors), ++P < 0.01 compared to control (B: nonstimulated cells); ∗∗P < 0.01 compared to F1 or F2, as appropriate. (B) Representative fluorescent images. CD45-FITC (green), DAPI (blue), fluorescent beads (red). Concentrations of fluorescent beads: F1, 107/ml and F2, 5 × 10⁷/ml. Microscopic magnification of the objective lens 20 × . Bar = 50 μm.