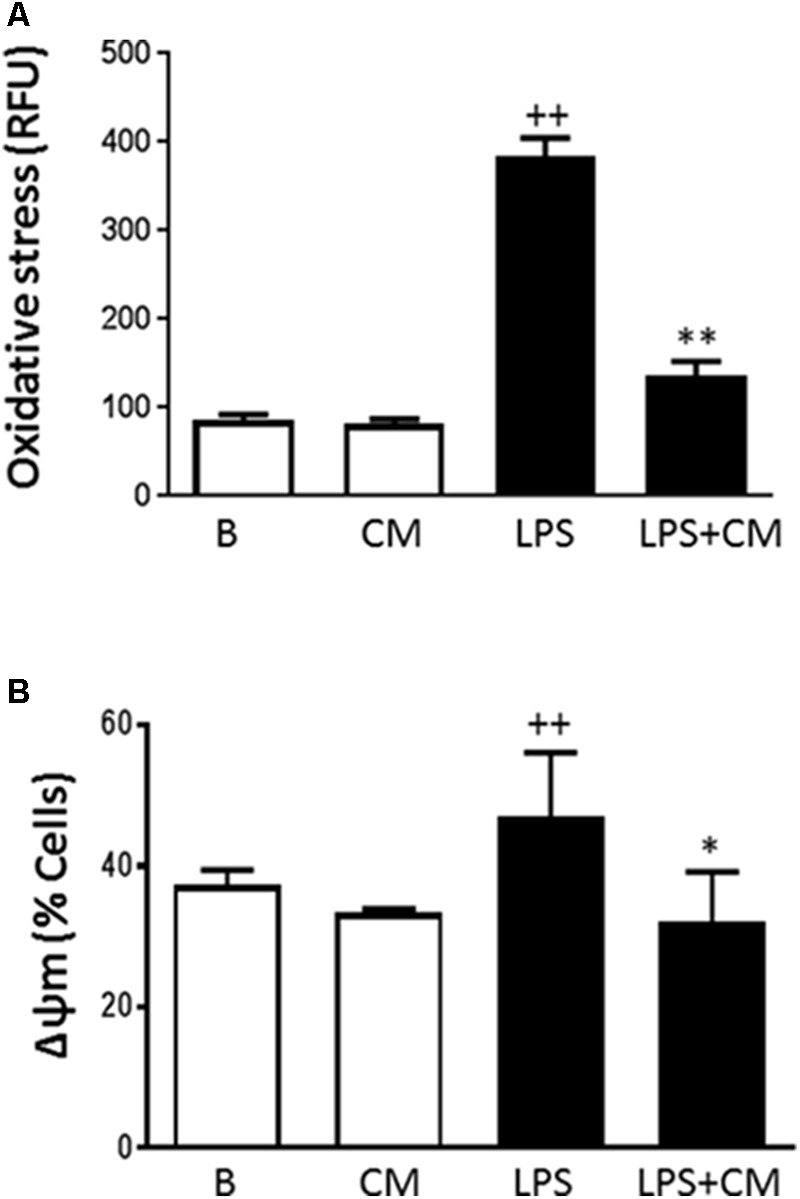
FIGURE 6.

Oxidative stress (A) and mitochondrial membrane potential (B) in human monocytes. Analysis was performed by flow cytometry using dihydrorhodamine (A) or the probe JC-1 (B). Cultures were treated with LPS alone or in combination with CM. Results are expressed as relative fluorescence units (RFU) (A) or percentage of cells with altered mitochondrial potential (B) (mean ± SD from 3 separate experiments with cells from separate donors). ++P < 0.01 compared to control (B: nonstimulated cells); ∗P < 0.05, ∗∗P < 0.01 compared to LPS.
