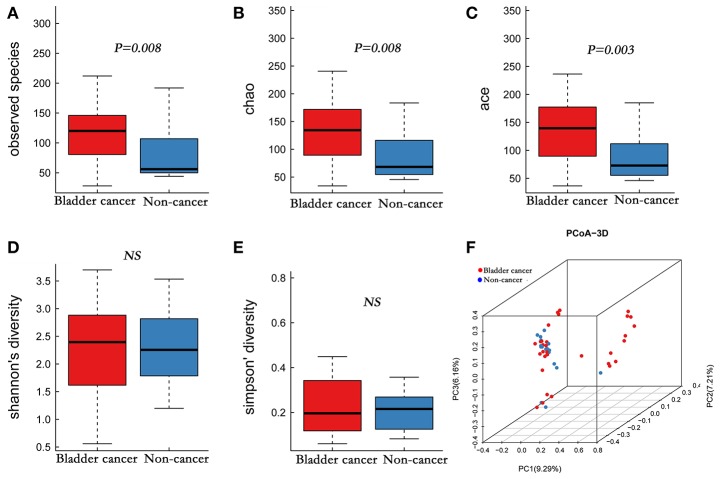
Figure 1.
Alpha and principal coordinate analysis (PCoA) for bladder-cancer samples and non-cancer samples. (A–E) Box-plot showing alpha diversity in samples using different metrics (A, observed species index; B, Chao1 index; C, Ace index; D, Shannon index; E, Simpson index). (F) PCoA plots of unweighed UniFrac distances in which samples were colored by clinical outcome. The PERMANOVA performed on the unweighted UniFrac distances showed that the observed differences were statistically significant (999 permutations; F = 2.53; P < 0.001).

