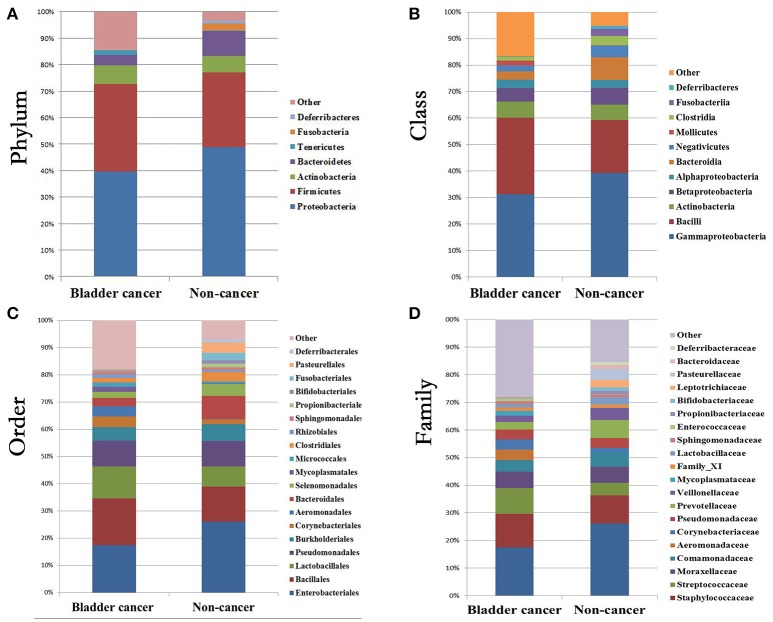
Figure 3.
Bacterial average relative abundance in bladder cancer and non-cancer samples. Average distribution of major taxa is represented by bar graphs. (A) phylum; (B) class; (C) order; (D) family. Each colored box represents a bacterial taxon and the height of a colored box represents the relative abundance of that organism within the sample. Bacterial genera with a relative abundance <1% and unclassified genera are grouped as “Other”.

