Figure 7.
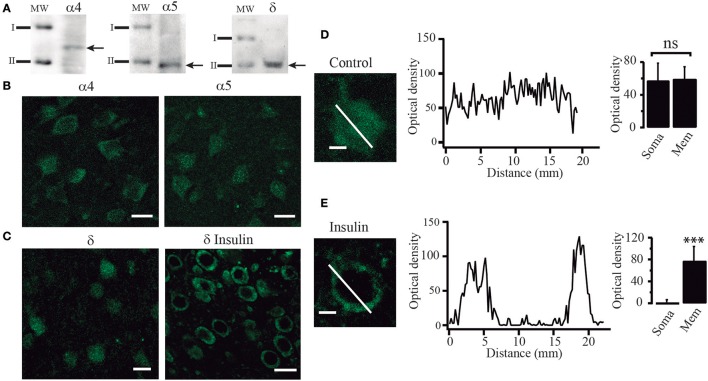
Insulin promotes the translocation of GABAA receptors from the cytoplasm to the cell membrane. (A) Western blot analysis showing immunoreactive products of tissue samples from layer 5–6 of PFC. Arrows indicate bands recognized by the anti-α4 antibody (left), anti-α5 antibody (middle), and anti-δ antibody (right), corresponding to protein with masses of 61, 49, and 50 KDa, respectively (I = 75 KDa, II = 50 KDa). (B) Immunoreactivity to α4 (left) and α5 (right) GABAA receptor subunits. (C) Immunoreactivity to δ receptor subunit in cells from control slices (left) and cells from slices incubated with insulin (δ insulin, right). Note that in the cells incubated with insulin, staining was stronger in the boundaries as compared with the control cells (D) High magnification image of a single non-incubated cell (control) stained with an anti-δ antibody (left). The graph in the middle shows the optical density measured through the length of the white line (distance). Optical density had small variations along the cell. Bar graphs indicate no difference of the optical density of the membrane (Mem) with respect to the soma in 24 cells (right). (E) A single insulin-incubated cell stained with an anti-δ antibody (left). The graph in the middle shows the optical density measured through the length of the cell (white line). The graph shows two peaks of optical density representing the white line crossing the limits. Note that when the white line crosses the soma the optic density is almost zero. Bar graphs indicate the difference in the staining of the membrane (Mem) with respect to the soma in 28 cells (right). Scale in (B,C), 20 μm. Scale in (D,E), 5 μm. ***p < 0.001.

