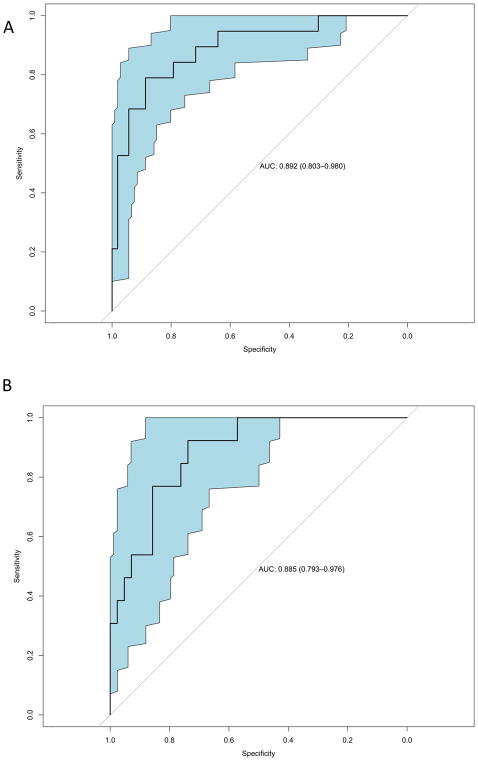
Figure 1. Predictive model and its performance on the development and validation cohort.
(A) Receiver Operating Characteristic curve for the development cohort of the MRI- based prediction model on pathological (near-)complete tumour response in rectal cancer; AUC = 0.892 with 95% confidence interval shown. (B) Receiver Operating Characteristic curve for the validation cohort of the MRI-based prediction model on pathological (near-)complete tumour response in rectal cancer; AUC = 0.885 with 95% confidence interval shown. Abbreviations: MRI = Magnetic Resonance Imaging; AUC = Area Under the Curve.

