Figure 5.

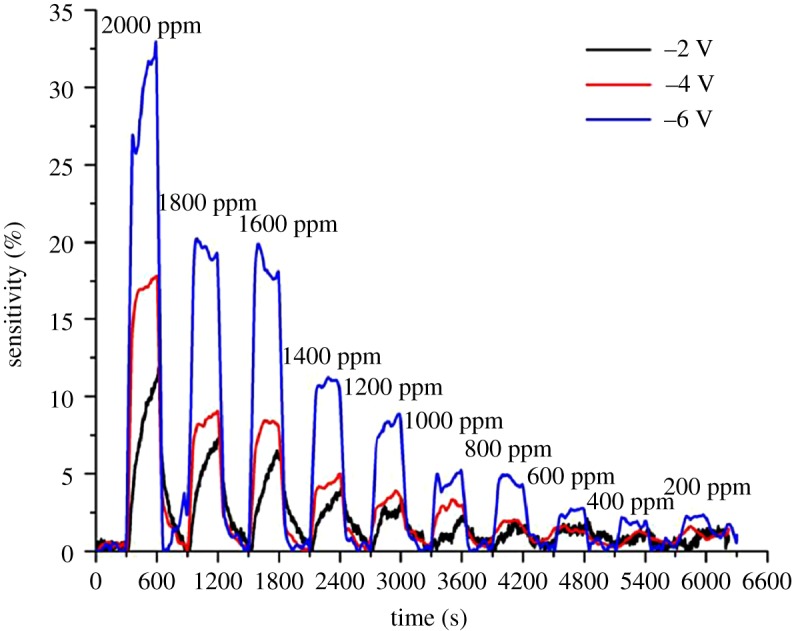
Sensitivity plotted against time when the ZnO sensor was exposed to hydrogen at different concentrations at room temperature at different reverse bias voltages.

Sensitivity plotted against time when the ZnO sensor was exposed to hydrogen at different concentrations at room temperature at different reverse bias voltages.