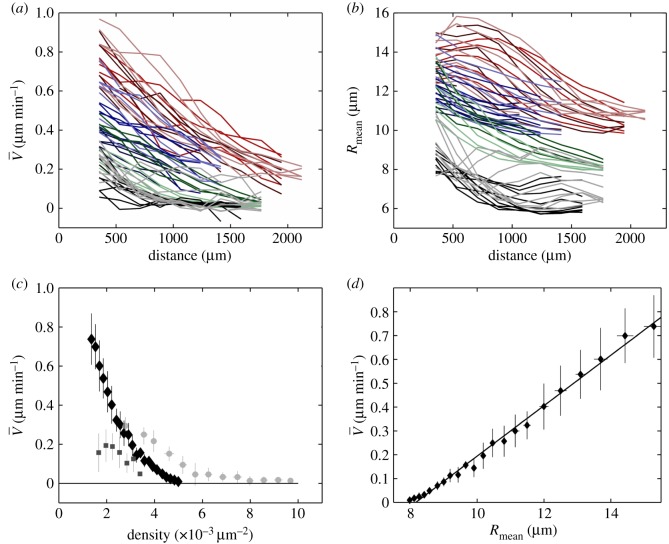
Figure 2.
Cell velocity and density profiles. (a,b) Large-scale profiles. Large-scale average of (a) cell velocity and (b) mean effective cell radius , plotted versus distance d to the moving front (oriented from the front towards the cell reservoir). Each colour marks a different batch, with initial cell radius (from reservoir to front): red, 10–12.5 μm; blue, 10–11 μm; green, 8–10.5 μm. For a given colour (i.e. batch), each shade marks a different strip. For a given shade (i.e. strip), each data point is the average in a bin. Grey and black curves are the same, for control experiments without mitomycin C, with initial density (from reservoir to front): grey, 8–10 μm; black, 7.7–7.9 μm. (c,d) Cell velocity–cell radius correlation. Same data as in (a,b), with mitomycin, binned and plotted as versus cell density (black diamonds) (c) or versus Rmean (d), with a linear fit (R=0.9931); N=8 strips. Light grey circles: control experiments without mitomycin C; N=3 strips. Grey squares: experiment with the drug CK666 to inhibit lamellipodia; N=5 strips. Horizontal and vertical bars: standard deviation (s.d.) within each bin.

