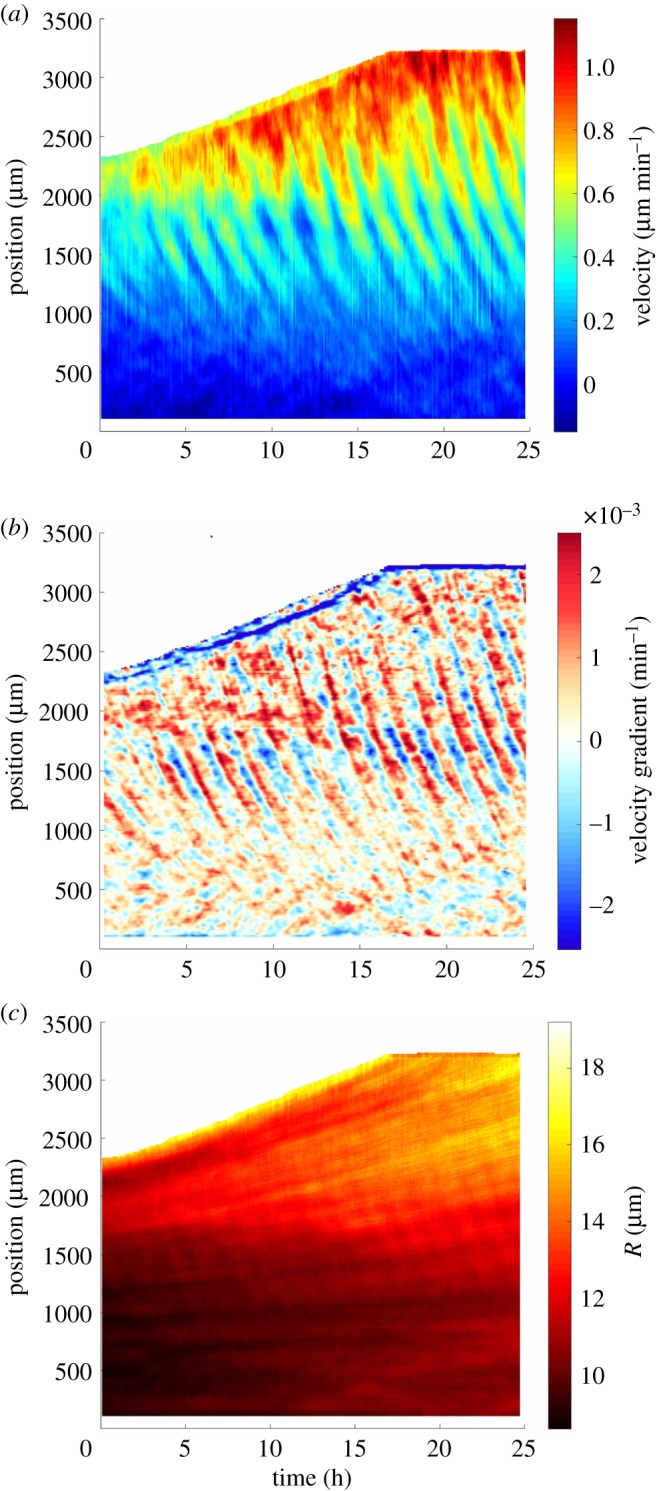
Figure 3.

Propagating waves. Space–time diagram (kymograph) of (a) cell velocity V , (b) velocity gradient and (c) effective cell radius R. Space x is oriented from cell reservoir (bottom, 0 mm) to towards the front (top, 3 mm), time t from left (0 h) to right (25 h) and the top-left region is the bare substrate in front of the monolayer. All eight strips showed similar results.
