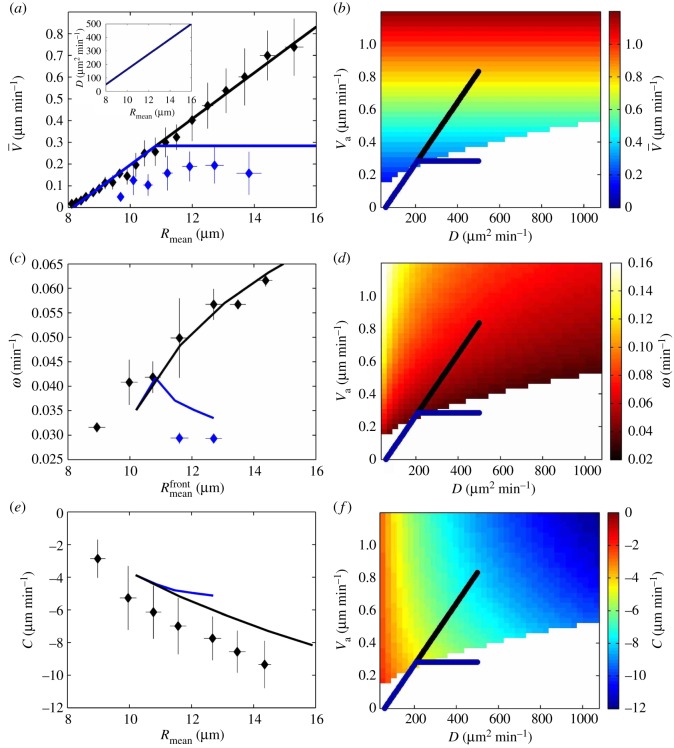
Figure 5.
Predictions of the phenomenological model. Realistic parameter values (strain–polarity coupling term m=25, polarization delay time , viscoelastic time ) are manually chosen to obtain a good agreement with the data (see text). (a) Large-scale average of cell velocity versus mean effective cell radius Rmean. Points are experimental data from figure 2c,d. Black: experiments with mitomycin; black line: linear relation; blue: experiments with lamellipodia inhibition using CK666 drug; blue line: we draw a linear increase followed by a plateau (see text for details). Inset: D versus Rmean, estimated relation, not affected by CK666. (b) Diagram of cell velocity versus strain diffusion coefficient D and active velocity Va. It is plotted in the region where the wave amplitude growth rate is positive (existence of waves). The regions where the wave amplitude growth rate is negative (the steady migration is stable) are left blank. Lines correspond to those in (a); Rmean is increasing from bottom left to top right. (c,d) Same for wave angular frequency ω, which depends on the mean effective cell radius; they are measured in a bin near the moving front (electronic supplementary material, figure S3B). (e,f) Same for wave velocity c; note that its values are negative, and that with CK666 drug the values of c are too noisy for quantitative measurements, but are similar.

