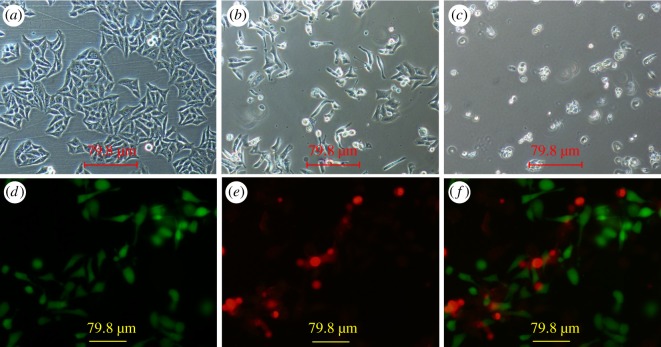
Figure 9.
Microscopic images of Hep-2 cells. (a) Cells untreated with PCL/PPD nanofibres, (b) cells treated with PCL/PPD nanofibres for 72 h, (c) cells treated with PCL/PPD nanofibres for 120 h; (d–f) fluorescence images of Hep-2 cells. (d) Living cells, (e) dead cells and (f) merged images of (d) and (e).

