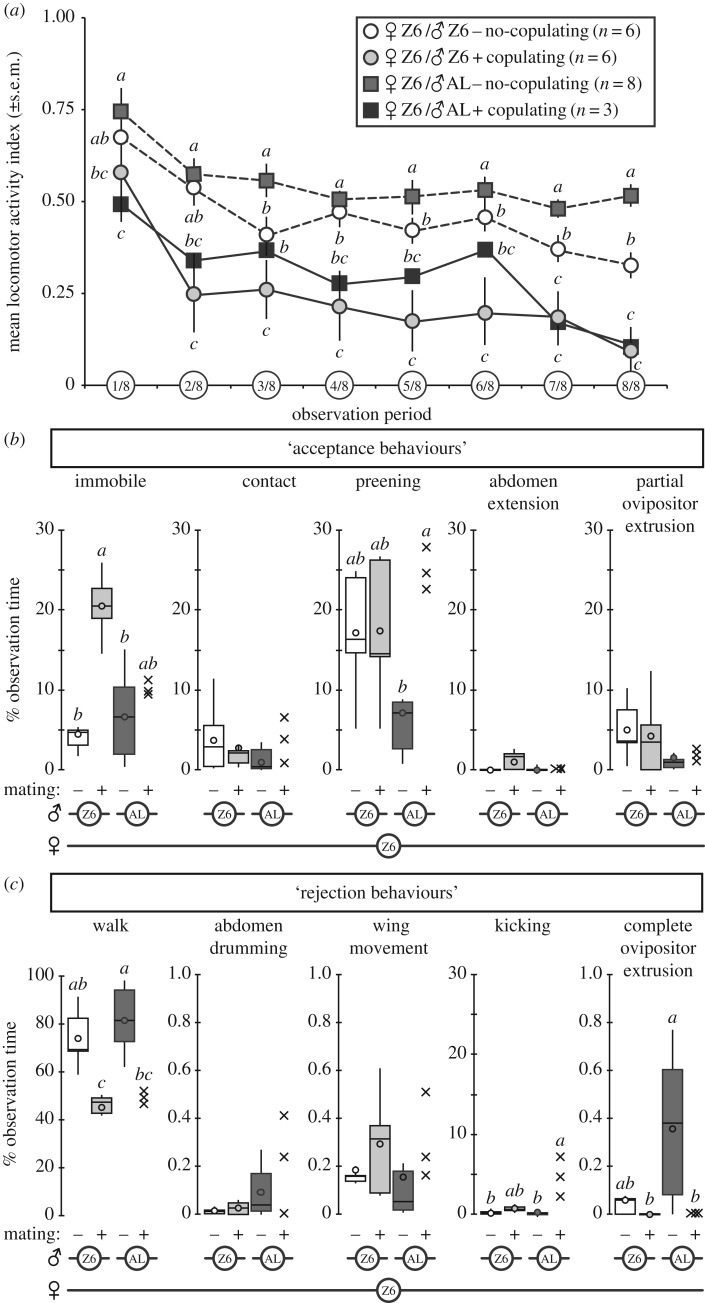
Figure 1.
(Overleaf.) Precise characterization of courtship behaviour. Mean locomotor activity (a) was measured in mating and non-mating homo- and heterotypic pairs consisting of one Z6 female and one Z6 or AL male. This measure was calculated for both flies, for each one-eighth of the total observation period (see Material and methods). For each period, mean locomotor activity was compared using a Kruskal–Wallis test, completed by Conover–Iman's multiple pairwise comparison (two-tailed with Bonferroni correction). Sample sizes are indicated on the figure; letters indicate statistically significant differences. Female behavioural components that predicted acceptance (b) or rejection (c) of the male were estimated as proportions of the observation time in homo- and heterotypic pairs consisting of one Z6 female and one Z6 or AL male, depending on mating (+, −; indicated at the bottom of the graphs). These proportions of active time are shown as box-and-whisker plots indicating the 25th and 75th percentiles (Q1 and Q3; boxes), the median (line within box) and the limits (whiskers) beyond which values were considered anomalous (these limits were calculated as follows: lower limit = Q1 − 1.5 × [Q3 − Q1] and upper limit = Q1 = 1.5 × [Q3 − Q1]) and were compared using a Kruskal–Wallis test. The letters above the whiskers indicate statistically significant differences.

