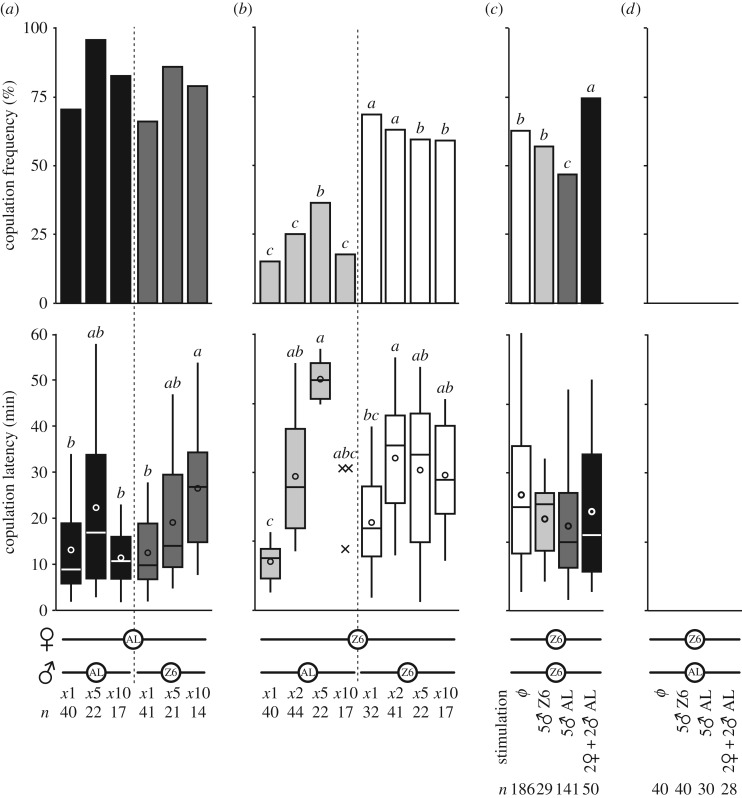
Figure 6.
(a,b) Effect of male number. Mating frequencies (bar graph) and latencies (box-and-whisker plots) were measured in single AL (a) or Z6 females (b) paired for 1 hour with 1 to 10 AL or Z6 males. For statistics, figure 2. (c,d) Effect of fly stimuli without physical contact. Mating frequencies (bar graph) and latencies (box-and-whisker plots) were measured in focal intact pairs (Z6 × Z6 or Z6 × AL) placed in the upper floor of a two-part copulation chamber (see electronic supplementary material, figure S1) in the presence of various combinations of live intact flies in the lower part. For statistics, figure 2.

