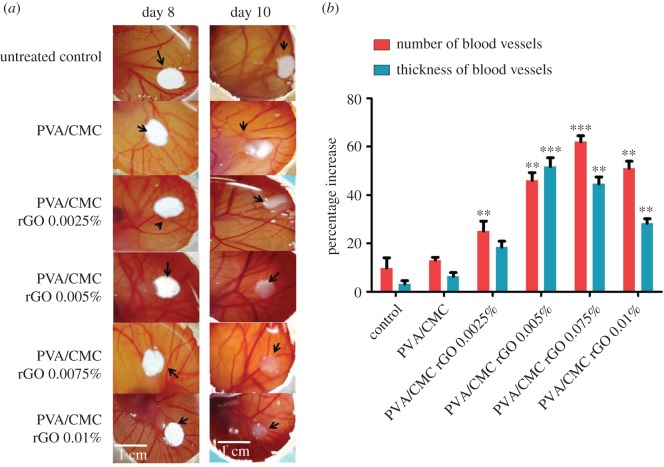
Figure 7.
(a) Digital images of the untreated and treated CAM and (b) percentage increase in the average number of blood vessels and average thickness of blood vessels obtained on day 10 of the CAM assay. The values are normalized to that of the untreated control on day 8 (n = 9, **p < 0.01 and ***p < 0.001 versus control).

