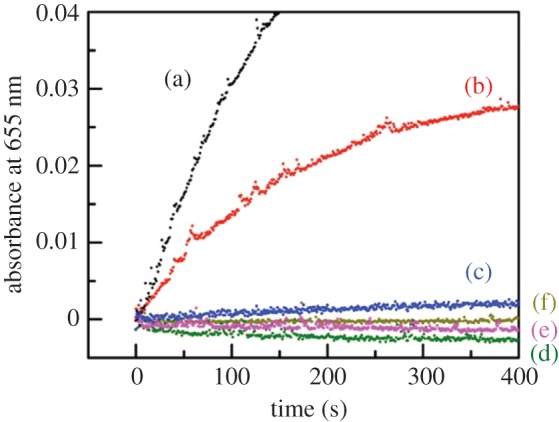
Figure 3.

The time course of absorbance at 655 nm of 0.14 mM TMBZ solution (0.1 M phosphate buffer) in the presence of 15 µM H2O2 and each of MP-11 from cytochrome c (a), NAcMP (b), NAcMPm (c), apo-NAcMP (d), haemin (e), and without the catalytic component (f) at 37°C. The concentration of catalysis component was 0.68 µM (natural MP-11, NAcMP and NAcMPm) or 0.81 µM (apo-NAcMP).
